Both, the Stores and the Roasts tab have a splitter than can be slided up to show charts that gives an overview on your stock and your production. Initially the splitter handle is at the end of the page and can be pulled up to show the extra pane. A simple click on the slider handle moves it fully up or fully down.
The charts shown depend on the data available in your account. If not enough data is available the corresponding chart is not drawn.
Watch out! On all charts you can hover with the mouse to get detailed information in tooltips.
Store Charts

Watch out! On can choose the list of stores to be covered by the store charts by the selector in the upper right corner.
Total Stock

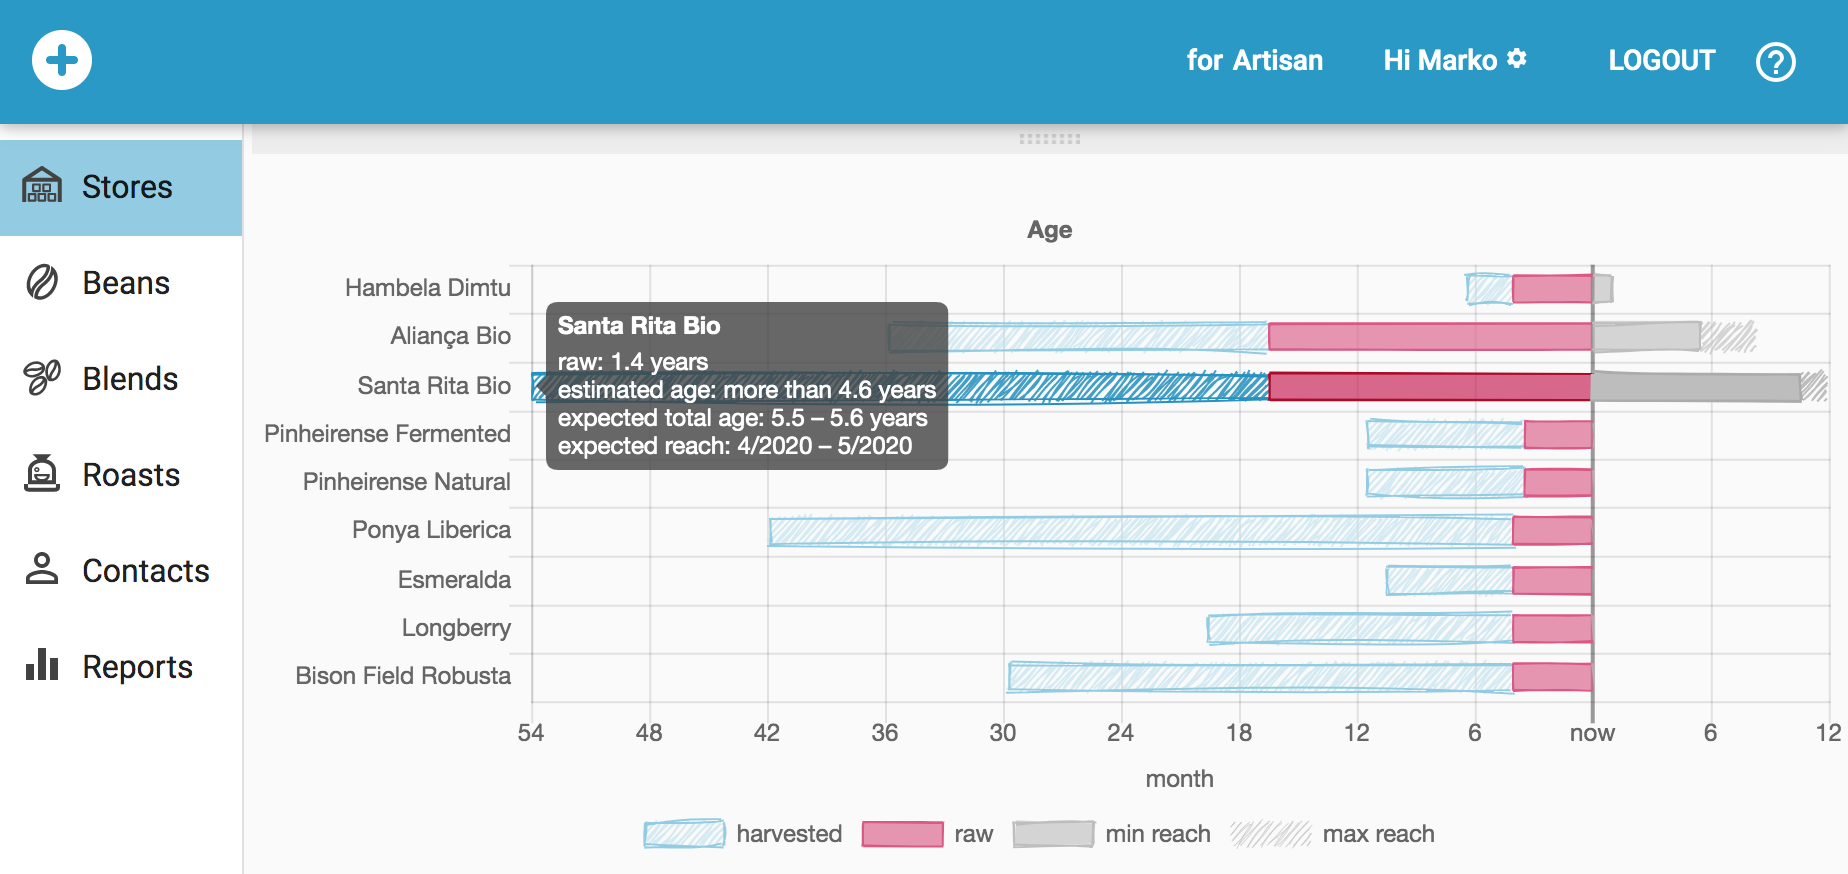
Age
Regions & Origins

Species & Varietals

Processing & Certifications

Moisture & Density

Roast Charts
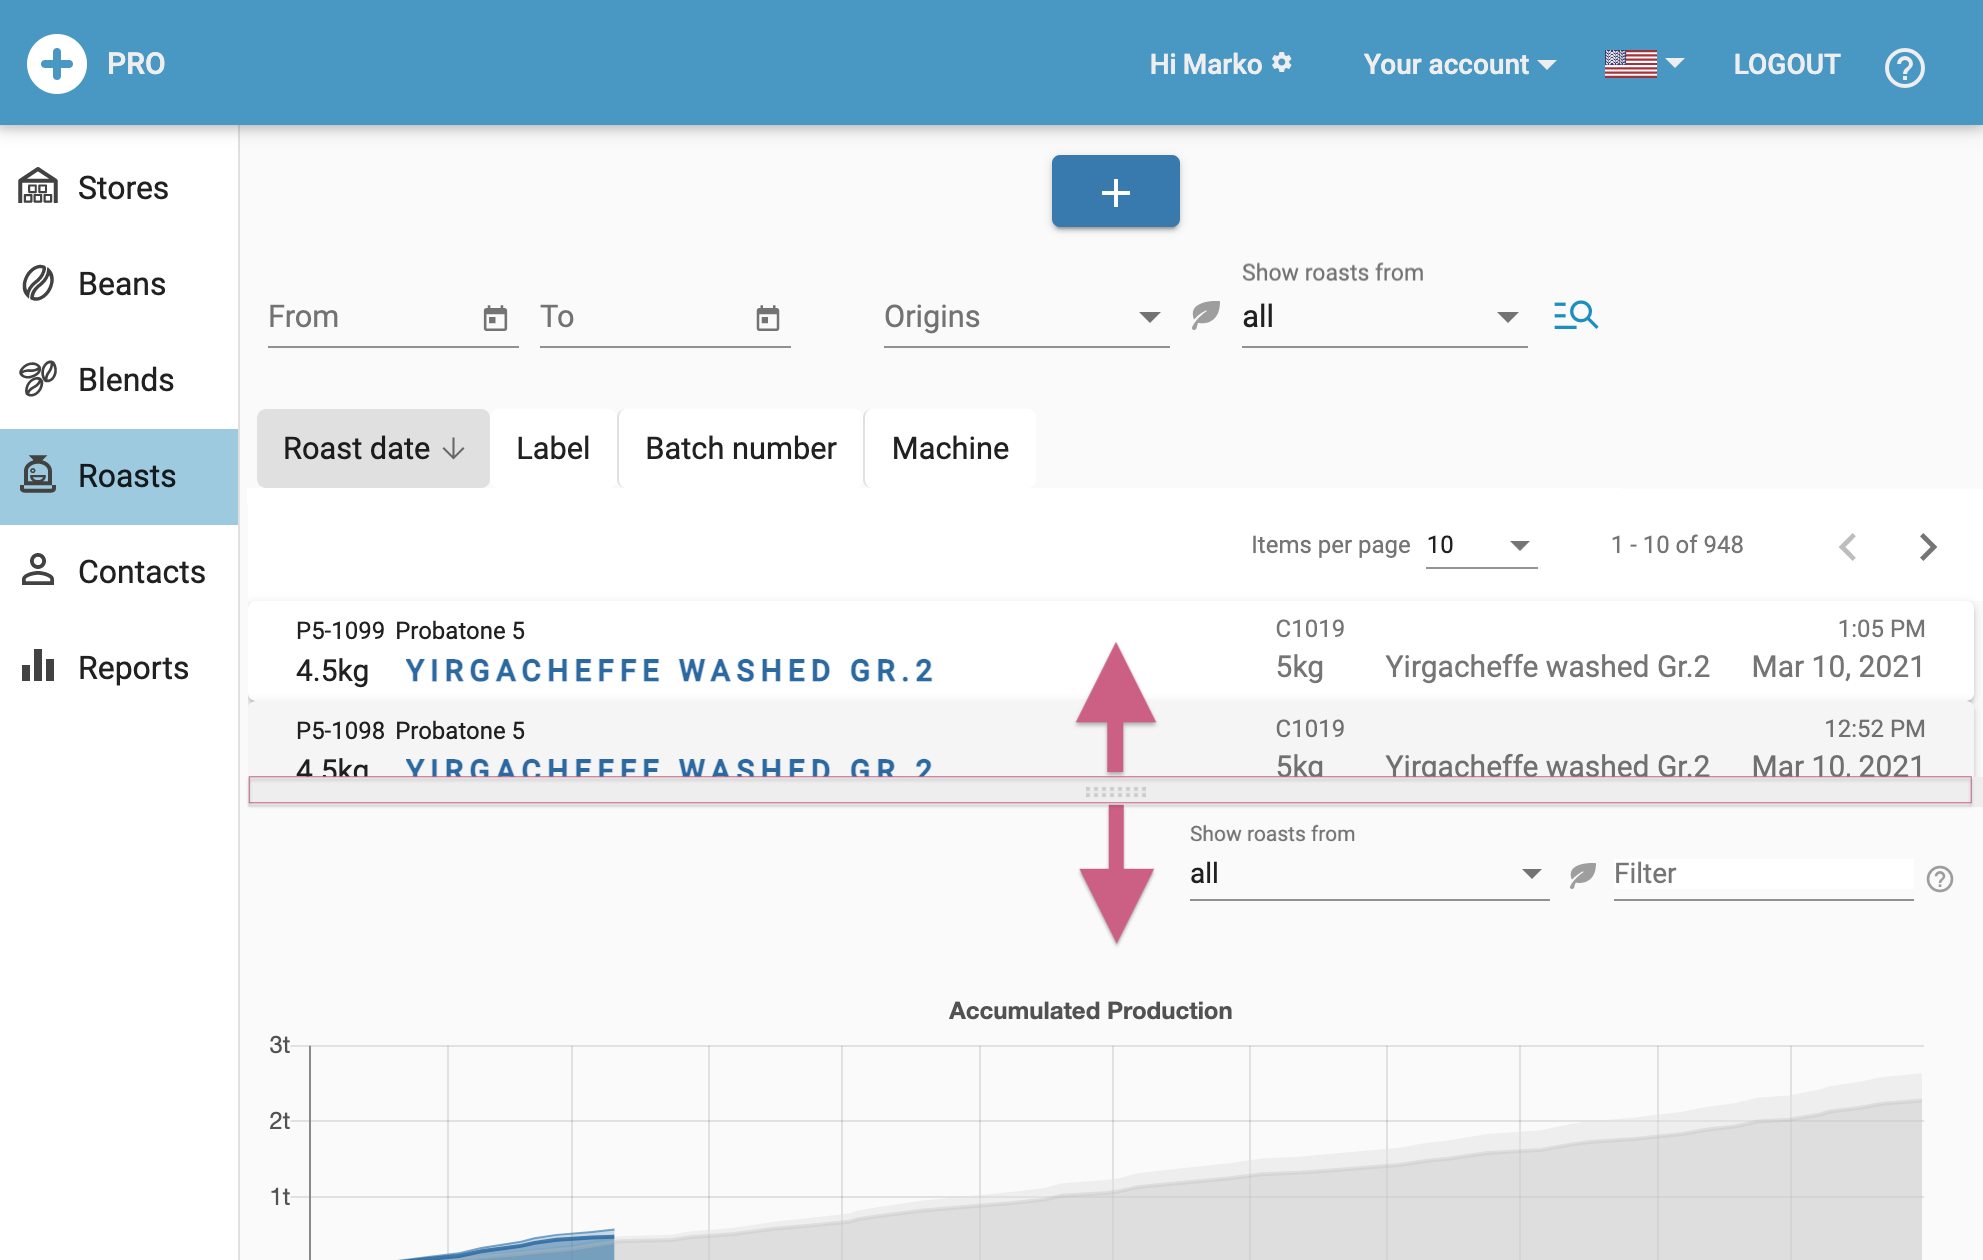
Watch out! A roast filter applies as well to the data shown in the roast charts.
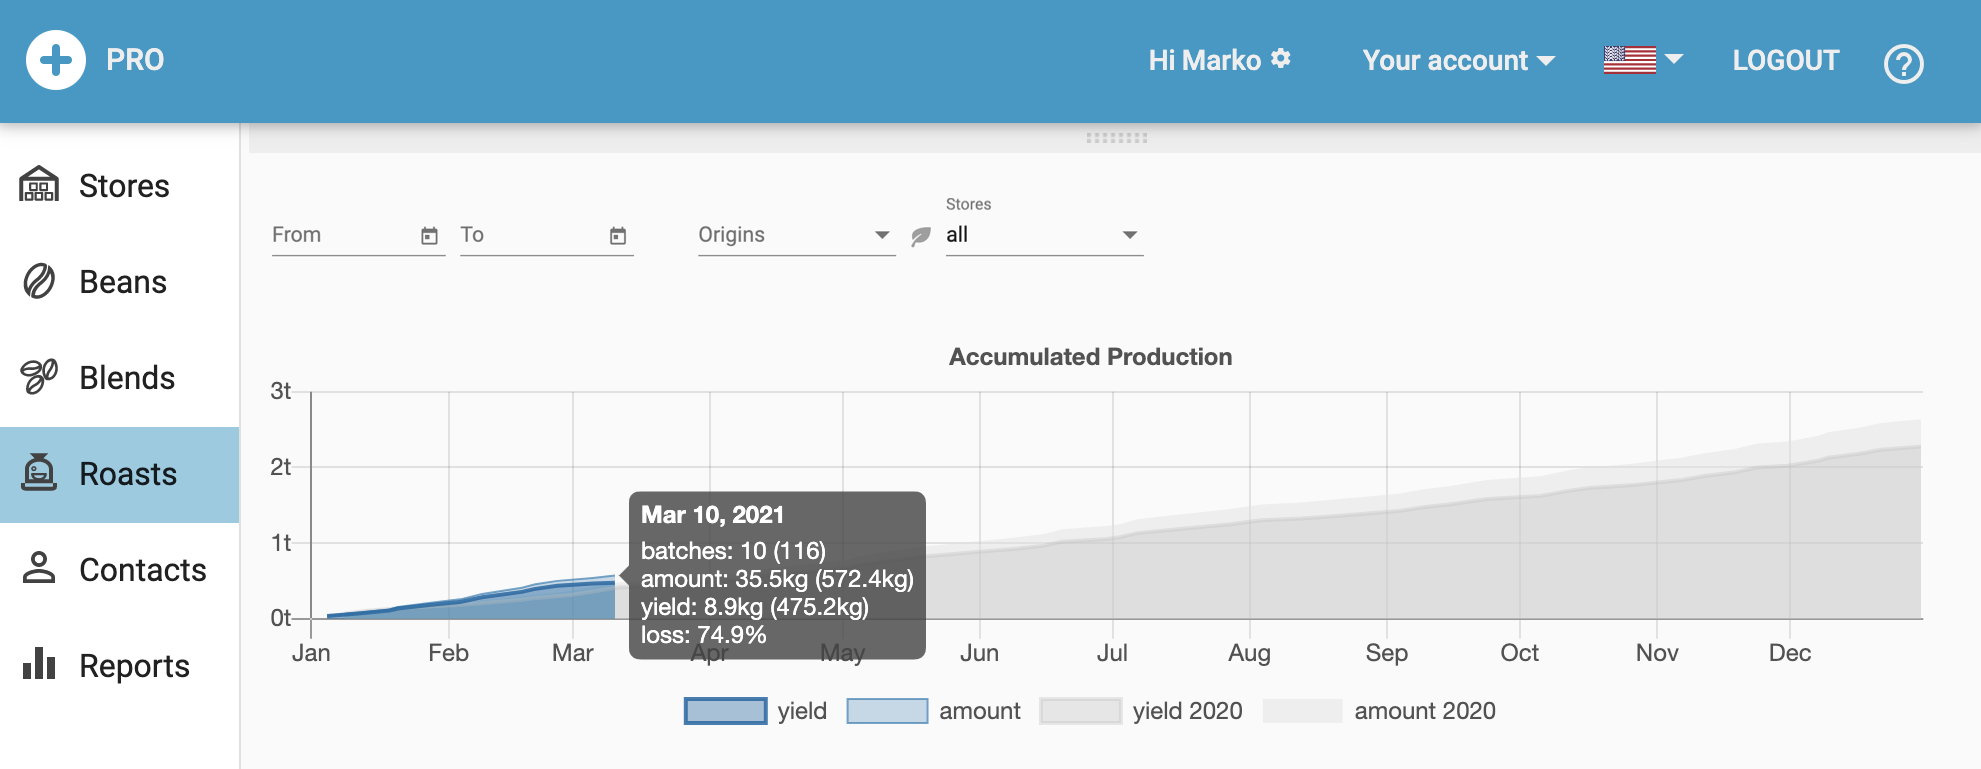
Accumulated Production
Yearly Production
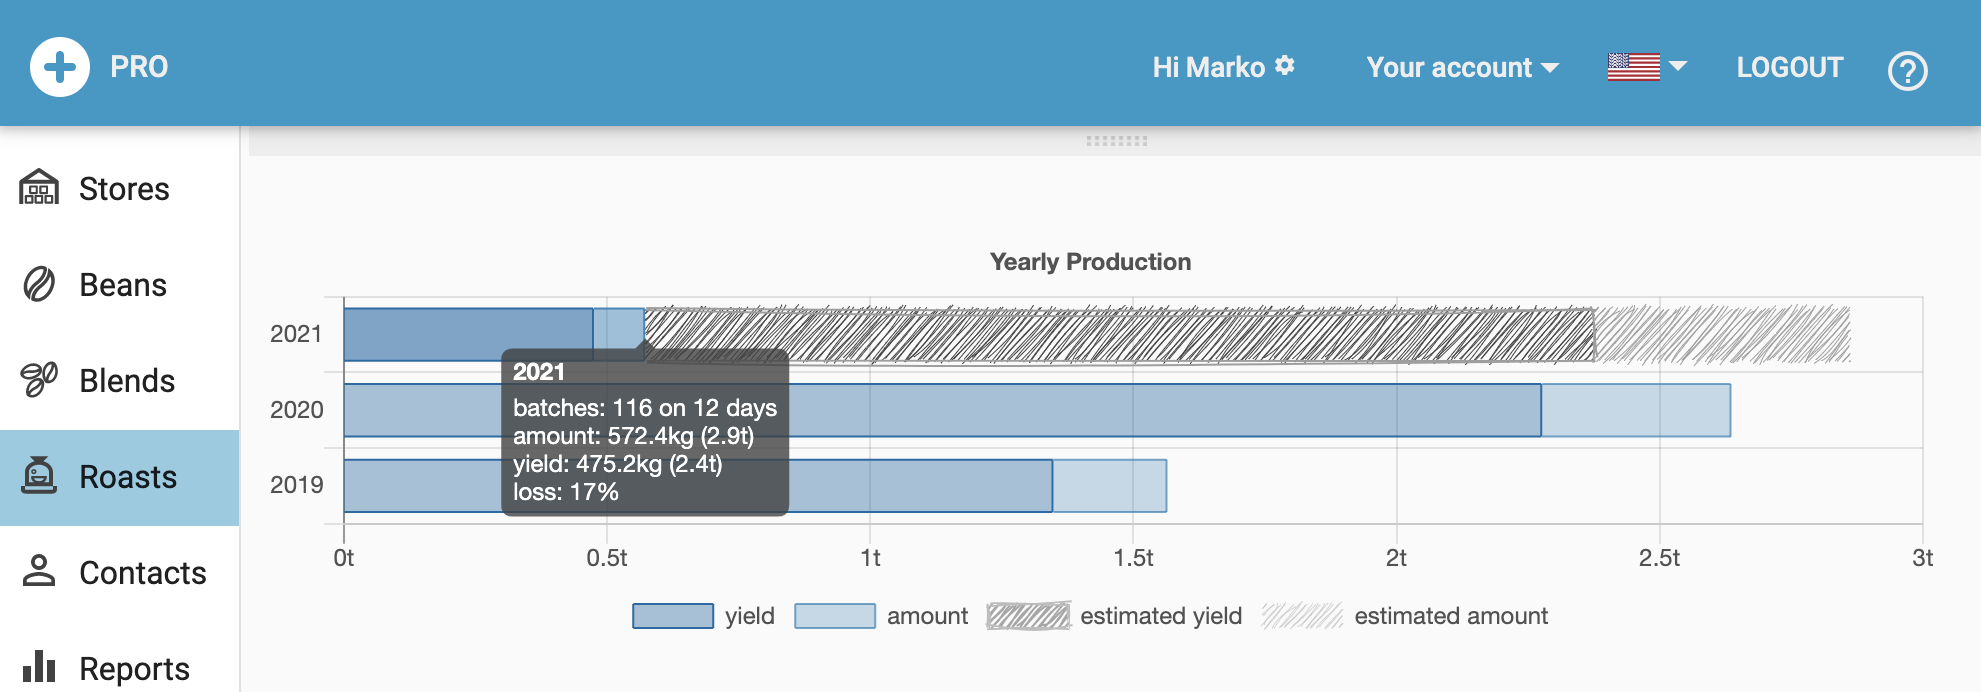
Monthly Production

Beans & Blends

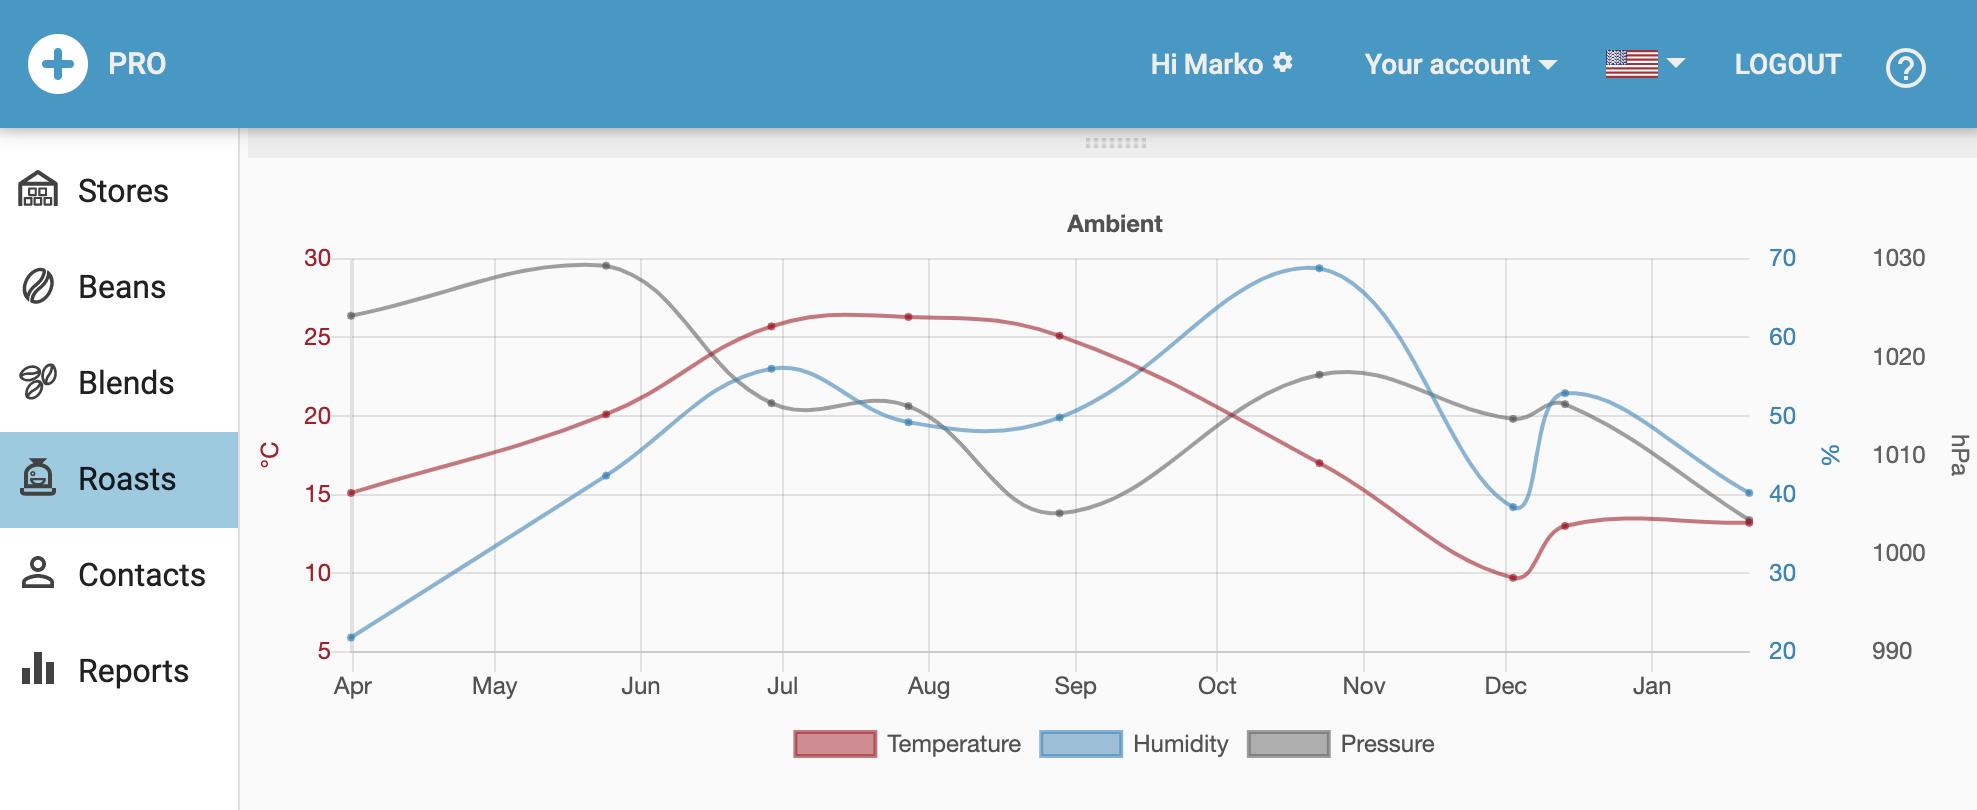
Ambient Data
