Quality in food production is achieved by selecting premium ingredients and fine tuning process parameters. Product tasting validates established quality standards across production runs. Coffee roasting quality is ensured through production cupping, yet this is time-consuming and costly. To focus effort, cupping can be restricted to batches with significant process parameter deviations.
RoastGuard allows you to define acceptable deviations for critical roasts parameters relative to its template profile. RoastGuard automatically identifies roasts outside these limits, not meeting your quality standards, for cupping.
Parameters
RoastGuard tracks several relevant roast parameters, including temperatures, development, and total time. RoastGuard also monitors temperature correlation over time, energy input, batch size, yield, roast loss, and color.
Time Parameters
Roasting time during the development phase, along with the total roast time, determine important characteristics of a roast. Additionally, the turn-around point (TP), can be useful in drum roasters to verify a proper between-batch protocol (BBP) and the yellow point to verify the length of the initial roasting phase.
- TP: turn-around point
- DRY: yellow point ending the drying phase
- FC: time until the onset of the first crack
- DROP: total roast time
- DEV time: the length of the last roasting phase between FC and DROP
- DEV ratio: the percentage of this last roasting phase with respect to the total roast time
Temperature Parameters
Deviations on product temperature at the following critical milestones of a roast may influence a roasts taste.
- CHARGE BT: charge temperature
- TP BT: bean temperature at turn-around, useful in drum roasters to verify a proper between-batch protocol (BBP)
- DRY BT: bean temperature at yellow point ending the drying phase
- FC BT: bean temperature (BT) at the onset of first crack
- DROP BT: drop temperature
- FC RoR: product temperature rate-of-rise at the onset of first crack
Curve Parameters
The comparison metric (CM) assigns a numeric value to the deviation of a foreground temperature curve from the corresponding curve of the roast template. CM calculates the square root of the average sum of squared differences between these curves. This measure is computed between the DRY phase (usually around 150°C or 300°F bean temperature) and the DROP phase (the end of the roast) after aligning the curves by the DROP event. In essence, this measure indicates how closely the curves match during this crucial final stage of the roast. Lower numbers signify better matching.
- CM BT: deviation of the bean temperature (BT) curves
- CM ET: deviation of the environmental temperature (ET) curves
Energy Parameters
The accumulated energy invested in a roast is measured by the Area under the Curve (AUC). Roasts can have similar AUC values even if they have different roast times.
- AUC: accumulated thermal energy
Weight Parameters
Batch size and the roast’s mass loss, which occurs due to moisture evaporation, gas release (such as CO2), and chaff during roasting, are important parameters for taste.
- Amount: batch size
- Yield: weight of the resulting roasted coffee
- Loss: weight loss of the green beans in percent
Color Parameters
Roast color, somewhat linked to roast time, is considered one of the most important metrics for determining the flavor of roasted coffee.
- Whole color: whole color of the roasted beans
- Ground color: ground color of roasted beans
Goals
Any of the above parameters can be observed by Roast Guard universally for all roasts or specifically for roasts of a particular template roast, provided an acceptable deviation range is specified.
Settings
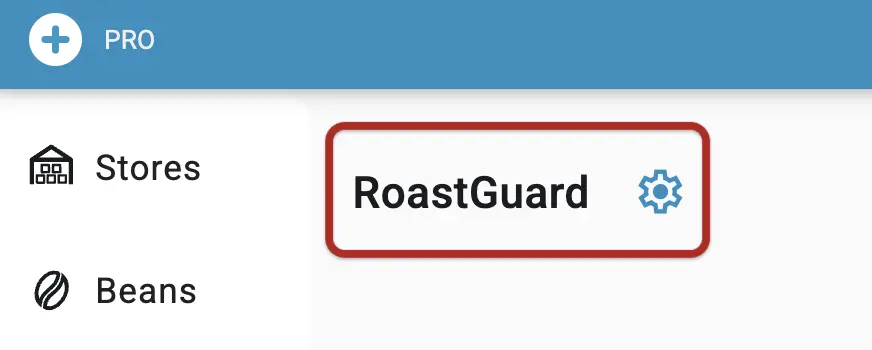
The central place to specify acceptable limits on selected roast parameters is the RoastGuard settings page, accessible from the settings icon depicted as a gear on top of the RoastGuard tab as well as the users main settings.
Watch out! Roast goals are user specific. Individual users of your artisan.plus account can establish a different set of roast goals. Therefore the evaluation results can vary between users on the same roasts.
You can decide which parameters should be checked and specify the acceptable ranges, either in terms of the measurement unit or as a percentage.
If a roast template is chosen, specific goals can be configured to be performed specifically for future roasts using that template.
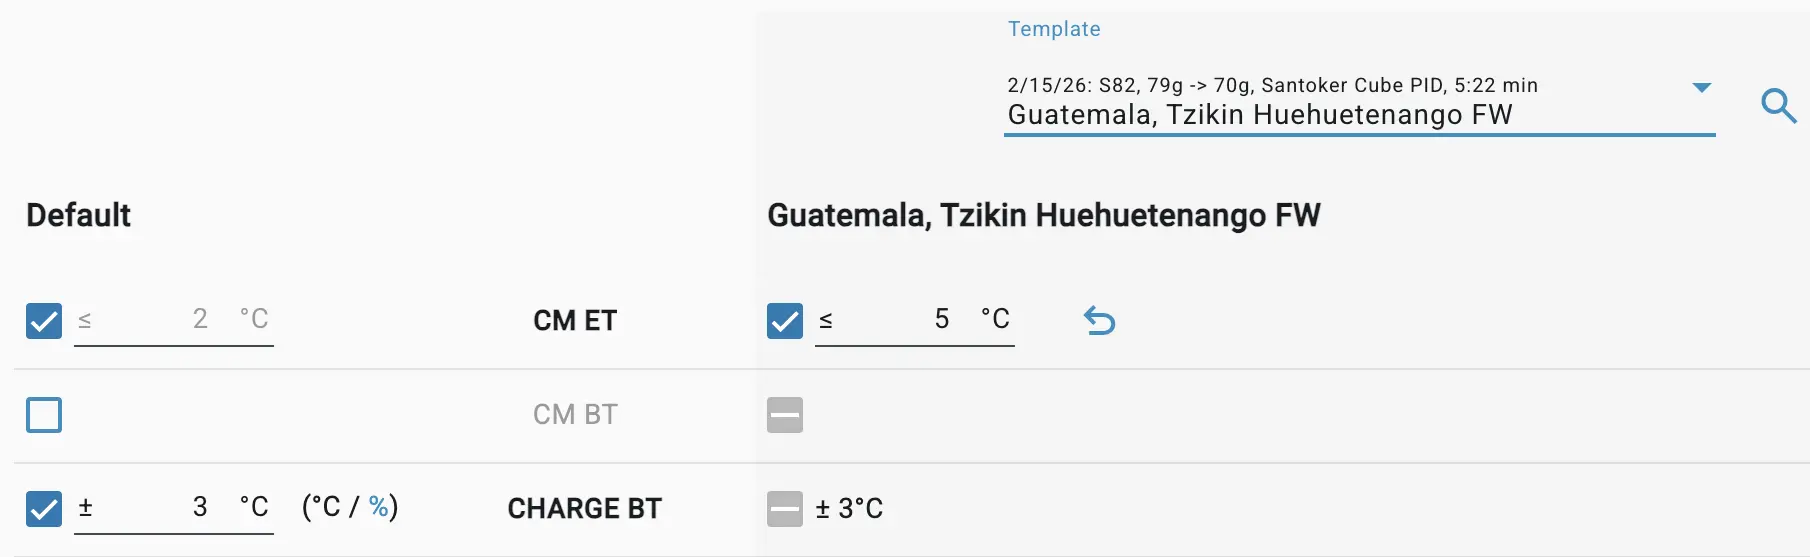
Watch out! The specific RoastGuard parameter limits assigned to template roasts override the corresponding active default limits, which are valid for all roasts.
Limits
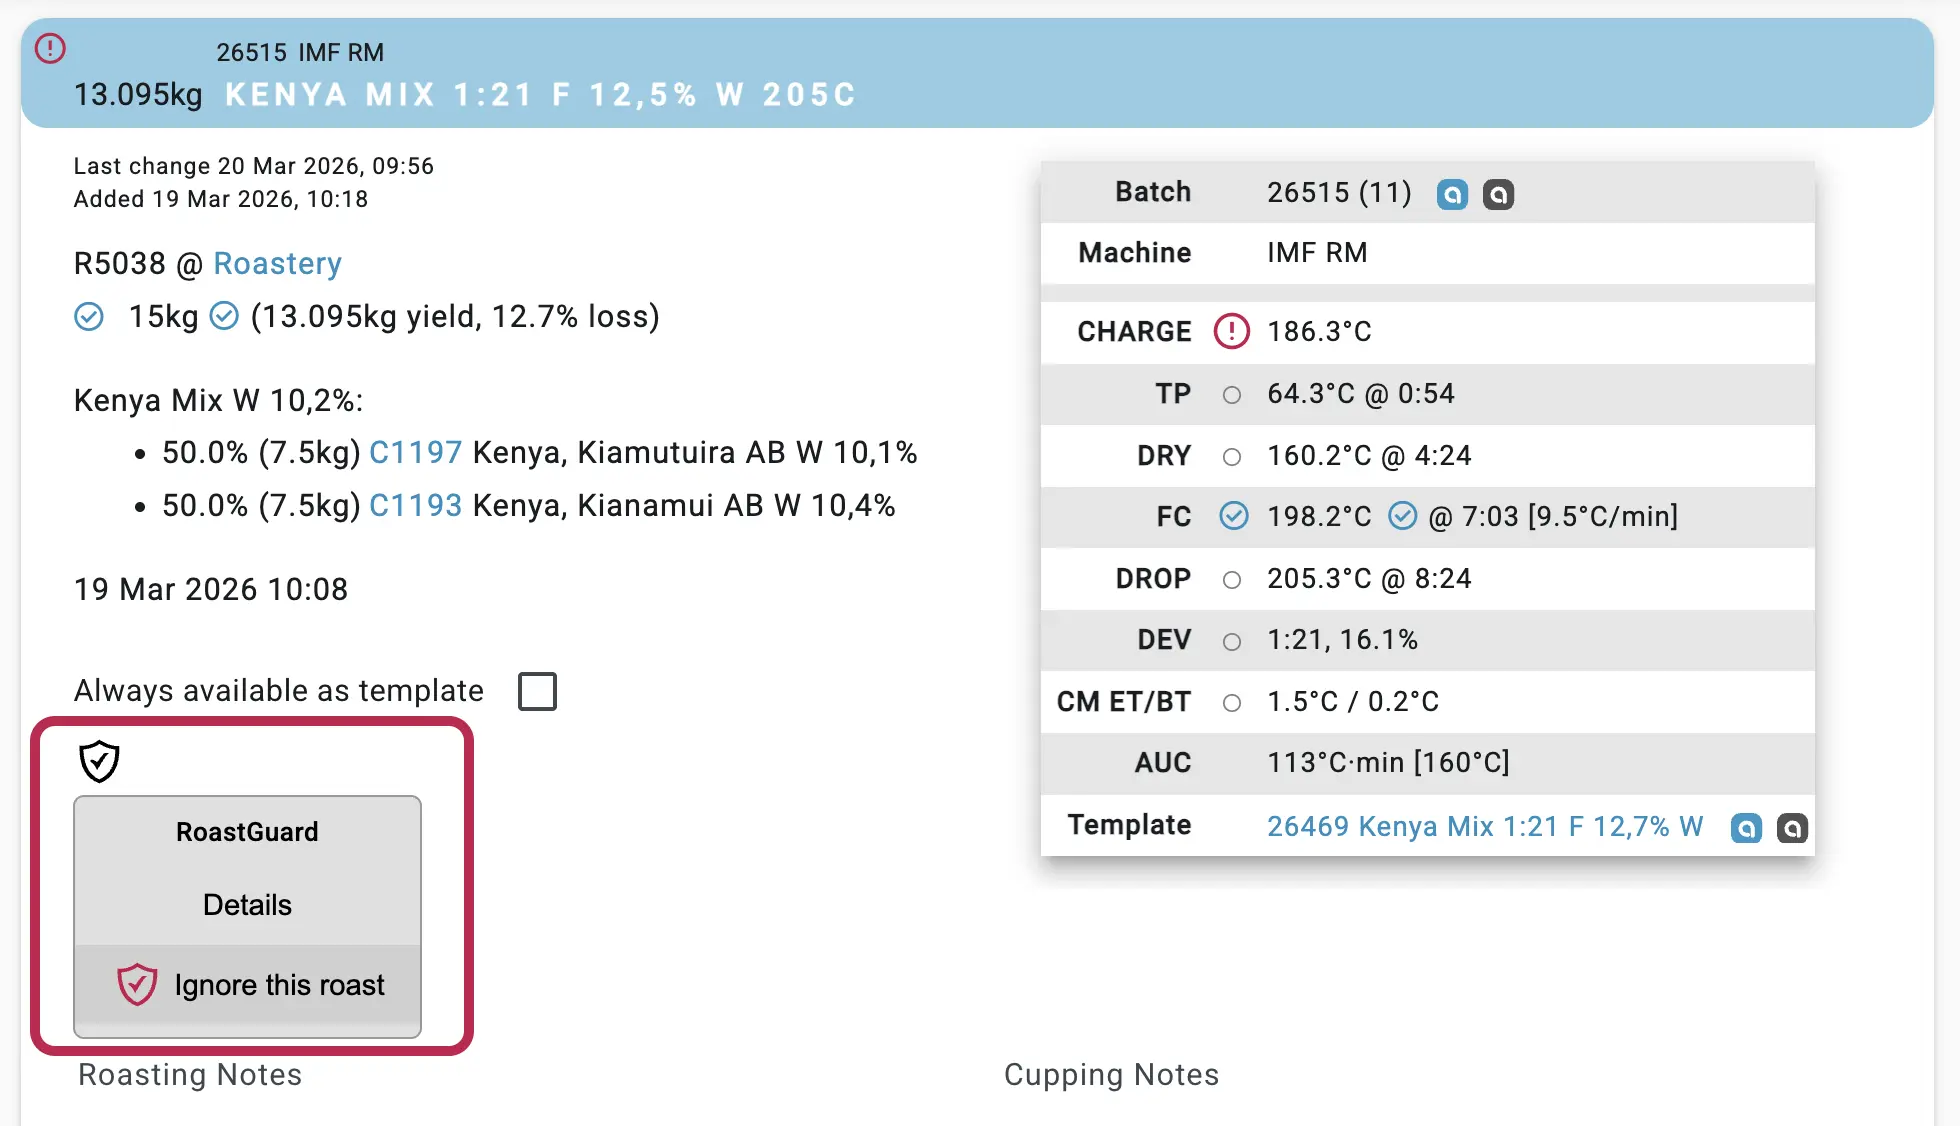
A quick way to adjust the limits on roast parameters is to click on one of the RoastGuard parameter status icons in the list of completed roasts. These icons not only display the current status of a parameter, whether it has a set limit or not (as shown above), or the comparison to the parameters set and whether it has passed or not (see Evaluation Results below). The user may quickly change its parameter settings by clicking on them.
Excluding Roasts from Evaluation
By default, the RoastGuard evaluates all roasts. However, you can exclude a roast from the evaluation by clicking the RoastGuard icon in a roast’s detailed view and selecting Ignore this roast.
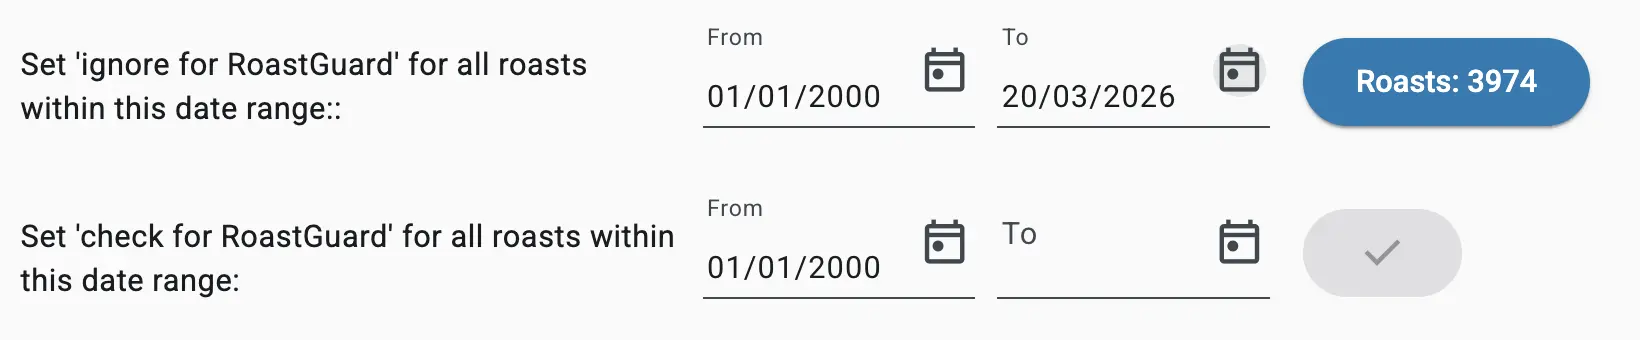
The RoastGuard settings page provides controls in the lower section that allow you to exclude or include all roasts within a specific time period for evaluation.
Watch out! Prior roasts without a template cannot be evaluated because there are no reference values to compare the readings against.
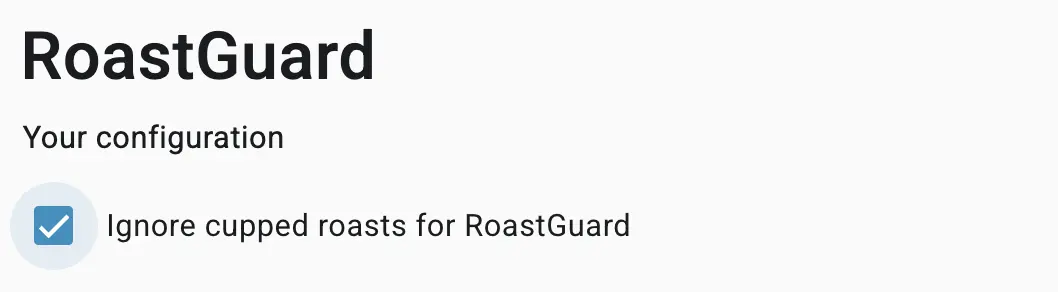
Cupped roasts
If the setting Ignore cupped roasts for RoastGuard on top of the settings page is checked, roasts with cupping results are assumed to be verified and therefore count as having been evaluated.
Evaluation
All set parameters are automatically evaluated over all roasts unless excluded. The evaluation results are presented in various ways.
Badge
The badge displayed in the RoastGuard tab indicates the number of roasts from your last roast day that failed to meet all of your goals.
Overview
The RoastGuard tab presents a comprehensive chart that outlines the ratio of roasts that achieved your desired outcomes, those that fell short of your goals, and those that were not evaluated.
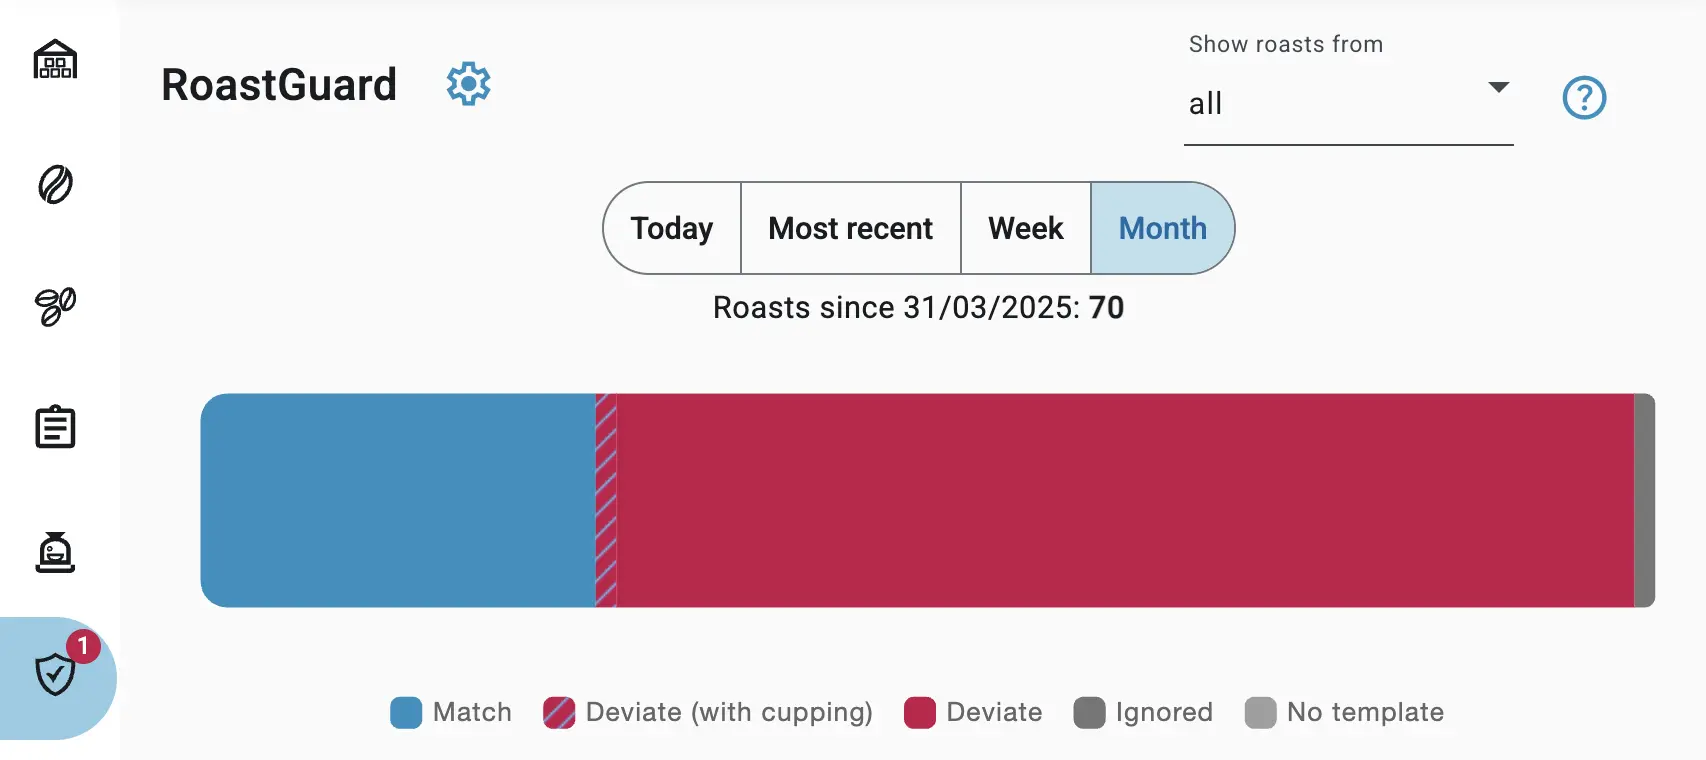
By default, the results from your last roast session are displayed. However, you can choose to show results for today, this week, or this month. Additionally, you can filter the results based on roasts that use beans from specific stores.
Deviations
Below the chart, you’ll find a list of the roasts from your last roast session that didn’t fall within the parameters set.
| Icon | State |
|---|---|
| no limits set | |
| values within the limits | |
| values exceeding the limits |
Opening a roast entry reveals the parameter values that passed the evaluation and those that failed. A circled tick mark signifies that a test met the desired goals, while a circled red exclamation mark indicates the parameter was not within the expected range. An empty circle signifies that the parameter was not evaluated.
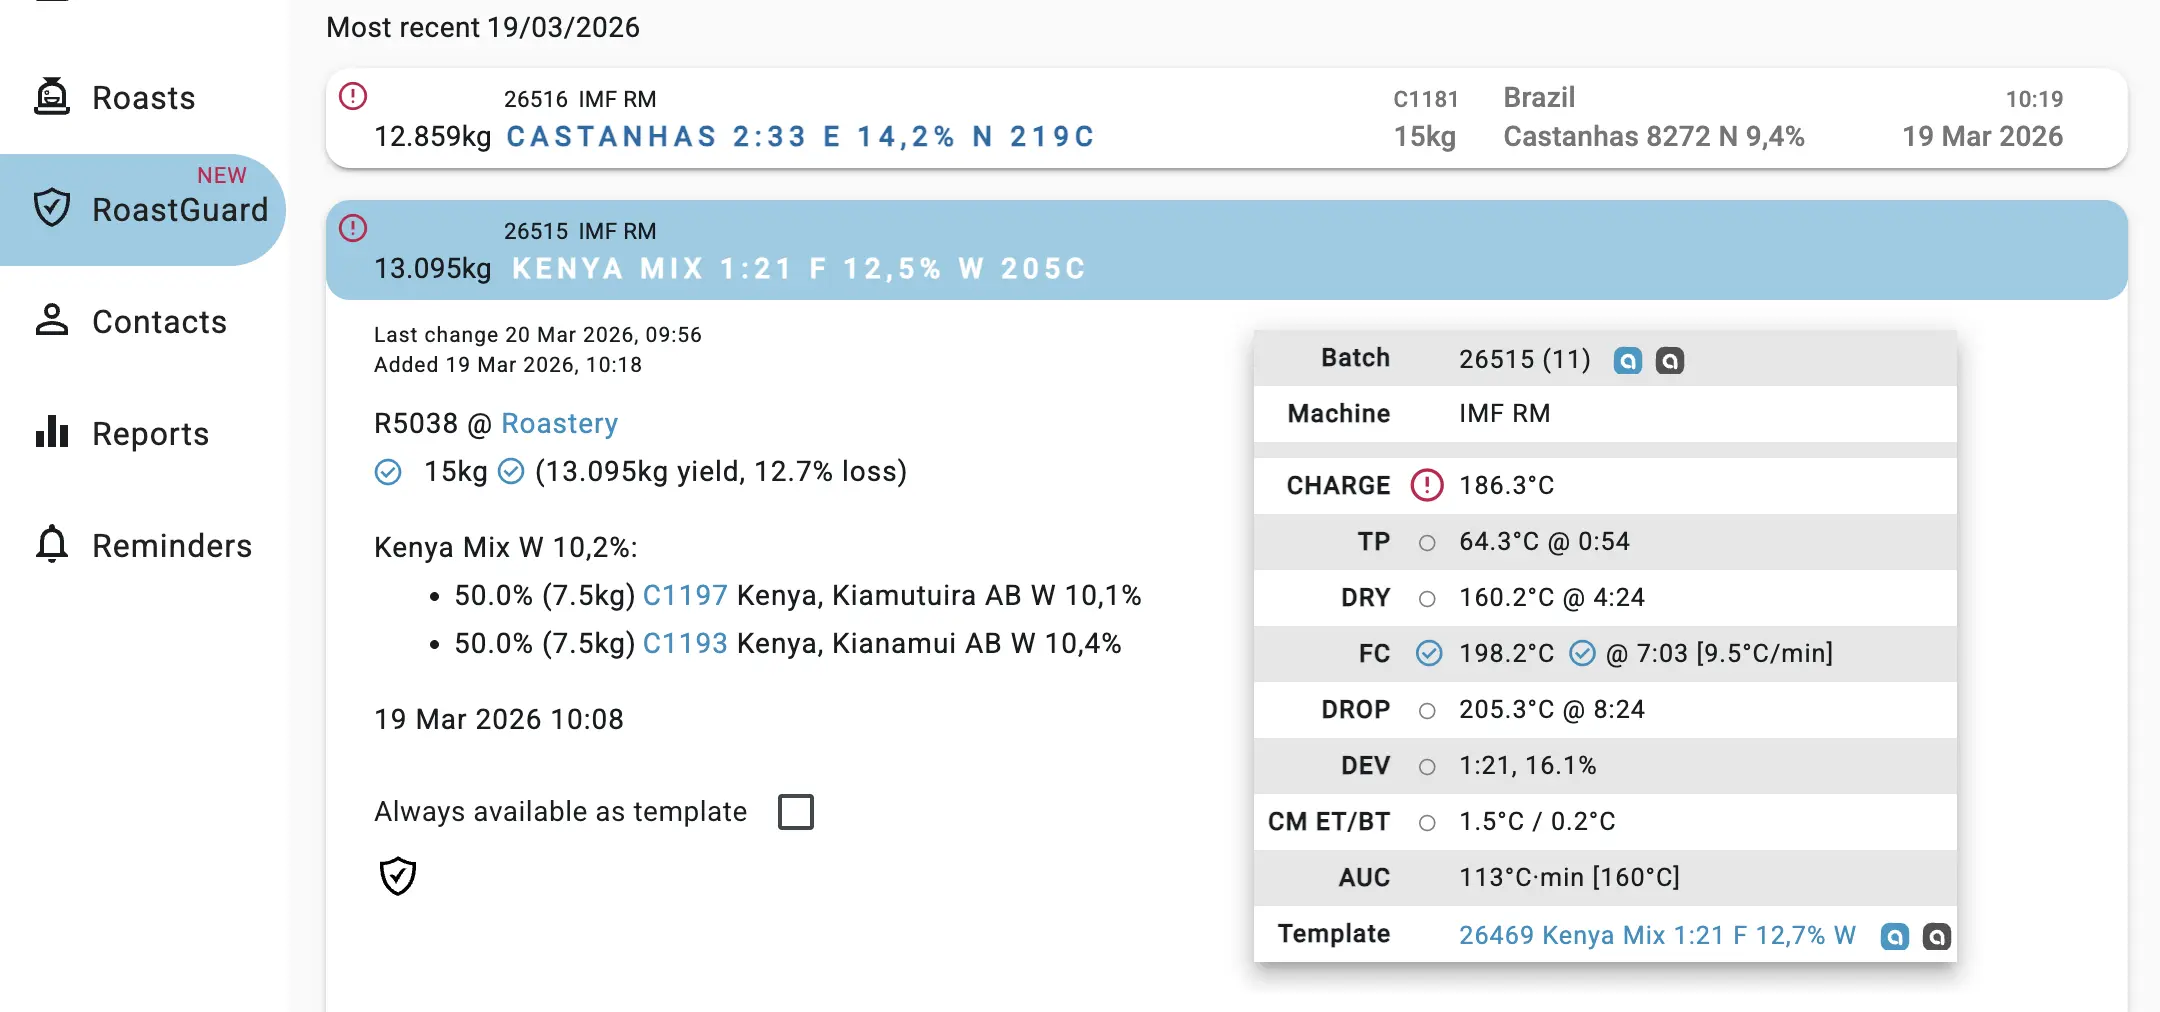
In the provided example, roast R5038 was flagged because its roast time deviated significantly from its template. However, the DROP bean temperature falls within the specified target range. Other parameters were not evaluated in this instance, as indicated by the gray empty circles next to the remaining parameters.
To quickly adjust the roast goals for any of these parameters, simply click on the corresponding evaluation icon. For more information on adjusting limits, refer to the section titled “Adjusting limits” above.
Watch out!
The roasts listed under the Roasts tab are marked with evaluation results in the same way as in this list of deviations. There you can use the RoastGuard icons at the top to filter out roasts meeting your goals and those that did not.
Details
Finally, the evaluation results are explained in detail in a popup that appears when you click the RoastGuard icon in a roast’s detailed view.